TL;DR
If you're running Docker for Mac and experiencing massive CPU spikes and slow response to Docker commands, ensure you've allocated enough memory and swap space to Docker. You can use the command below to inspect the Linux virtual machine that Docker is running in.7
docker run -it --rm --pid host alpine /bin/sh
Then run top for CPU/mem usage and iostat -m for IO stats.
In my case, the CPU spikes were caused by memory starvation; the kswapd0 process was running hot, indicating likely thrashing.
I've been working on packaging software for several different Linux
distributions. Docker containers provide a great environment to build and test
such packages. A little work is required to set up the containers to properly
imitate each operating system (e.g. installing and running the appropriate init
system), but once done you're left with a lightweight environment that can be
used to run tests across many different Linux distributions. Managing it with
Docker Compose gives further flexibility and ease of use. Until, of course, your
tests begin failing intermittently and Docker itself comes to a
screeching halt, grinding away for many seconds at simple docker-compose ps
commands.
Such was my dilemma.
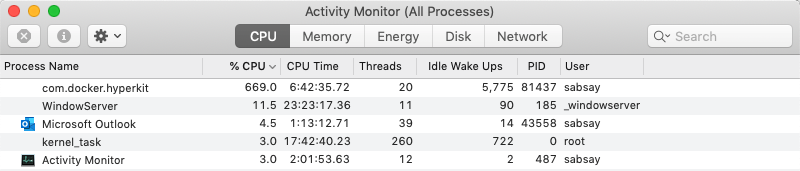
To be more exact, my Docker Compose environment worked fine for about a minute after starting. I could run the tests on the package (against all containers) successfully one or two times. But then things would go south. The tests started failing. The Docker daemon took ages to respond to simple commands. Meanwhile, my laptop fans kicked into high gear and I noticed something peculiar:
This behavior was consistent. I tore down the containers and started them up. Same problem. I restarted the Docker daemon. Same problem: things worked briefly and then broke.
I jumped on Google and started searching with the only searchable symptom I had: massive CPU usage. Almost immediately, I found com.docker.hyperkit 100% cpu usage is back again, an extremely popular GitHub issue on the Docker for Mac repository. The bug is still not fully understood, but the symptoms and mitigations proposed seemed relevant to my own problem. In short, the issue describes how, while running no containers at all, Docker CPU usage spikes (multiple times per day) and Docker commands lock up. I only noticed my problem while running containers, but that's a detail I (mistakenly) didn't give enough consideration to.
The current hypothesis for the bug's cause involves filesystem synchronization between macOS and the Docker VM 1:
Things that can cause the infinite loop seem to involve syncing of file system events between OS-X and the docker VM. The fewer file system shares you have, the less likely this is to occur. Similarly, if you can switch your filesystem mounts to :cached then that means there will be fewer notifications being sent back and forth between the Docker VM and OS-X, just less chance of the issue.
I knew my Compose environment was utilizing bind mounts with potentially high read/write frequency 2, so it seemed plausible that this bug report and my issue sprouted from the same core problem. Even if they didn't, the mitigations proposed in the bug report gave me some easy ideas to try.
As suggested in the GitHub Issue, I removed a couple unnecessary file sharing mounts from my Docker settings. No change.
The GitHub Issue mentioned using a
:cached setting on bind mounts, which I was unfamiliar with. So I read
through
this
and this to learn that
bind mounts on Docker for Mac had some pretty severe performance problems circa
2016, and that the cached and delegated options were developed in response
to that. They essentially provide a slightly-less-than-perfectly-consistent
synchronization between the container filesystem and the macOS filesystem.
Depending on your circumstance, one is a better choice than the other. But in my
case, I didn't actually need a bind mount at all. So I changed the suspect
bind-mount to a non-mounted Docker volume (i.e. a Docker volume not visible on
the macOS filesystem).
Unfortunately, my problem remained.
I came across Diagnosing high CPU usage on Docker for Mac on StackOverflow, which seemed like exactly what I needed. The author asks:
How do I diagnose the cause of Docker on MacOS, specifically com.docker.hyperkit using 100% of CPU?
There are a couple answers, one of which involves using dtrace to look at
(macOS) kernel stack traces. Yikes! I'll save that for later, if I get
desperate. Thankfully, this answer
offered a quick way to look at the performance stats of the Docker VM
itself.
Normally when you run a container, you want that container to be as isolated as
possible from other containers/processes on the system. By default, a Docker
container is given its own PID namespace, which means it can't see other
processes on the system, and PIDs can be "reused" (i.e. your container can have
a PID 1 despite the fact there is already a PID 1 on the underlying system). Turns
out it's pretty easy to break out of this isolation if you want to. By
specifying the host option, the container is given access to the host's PID
namespace:
docker run -it --rm --pid host <image name> <command>
See the Docker
docs on the
--pid flag.
Note that in this case, "host" refers to the Docker VM, not the macOS host. Remember, with Docker for Mac we're running containers inside a Linux VM, which is in turn running on macOS.
Equipped with this new debugging ability, I can now look at what's happening in the Linux VM. I start a shell with this command:
docker run -it --rm --pid host alpine /bin/sh
and start looking around. I look at IO stats:
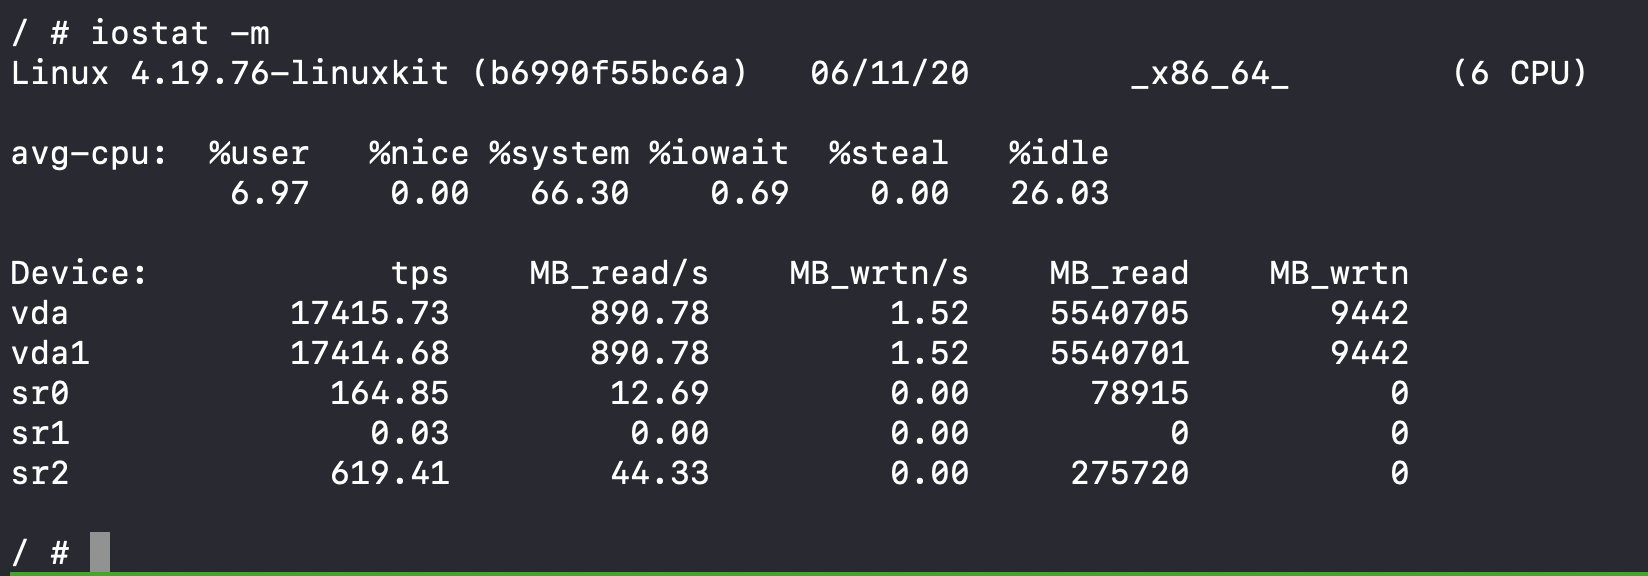
Wow! 890MB of reads per second?! Seems kinda crazy. But I don't know if it's unusual, as I don't know what "normal" looks like.
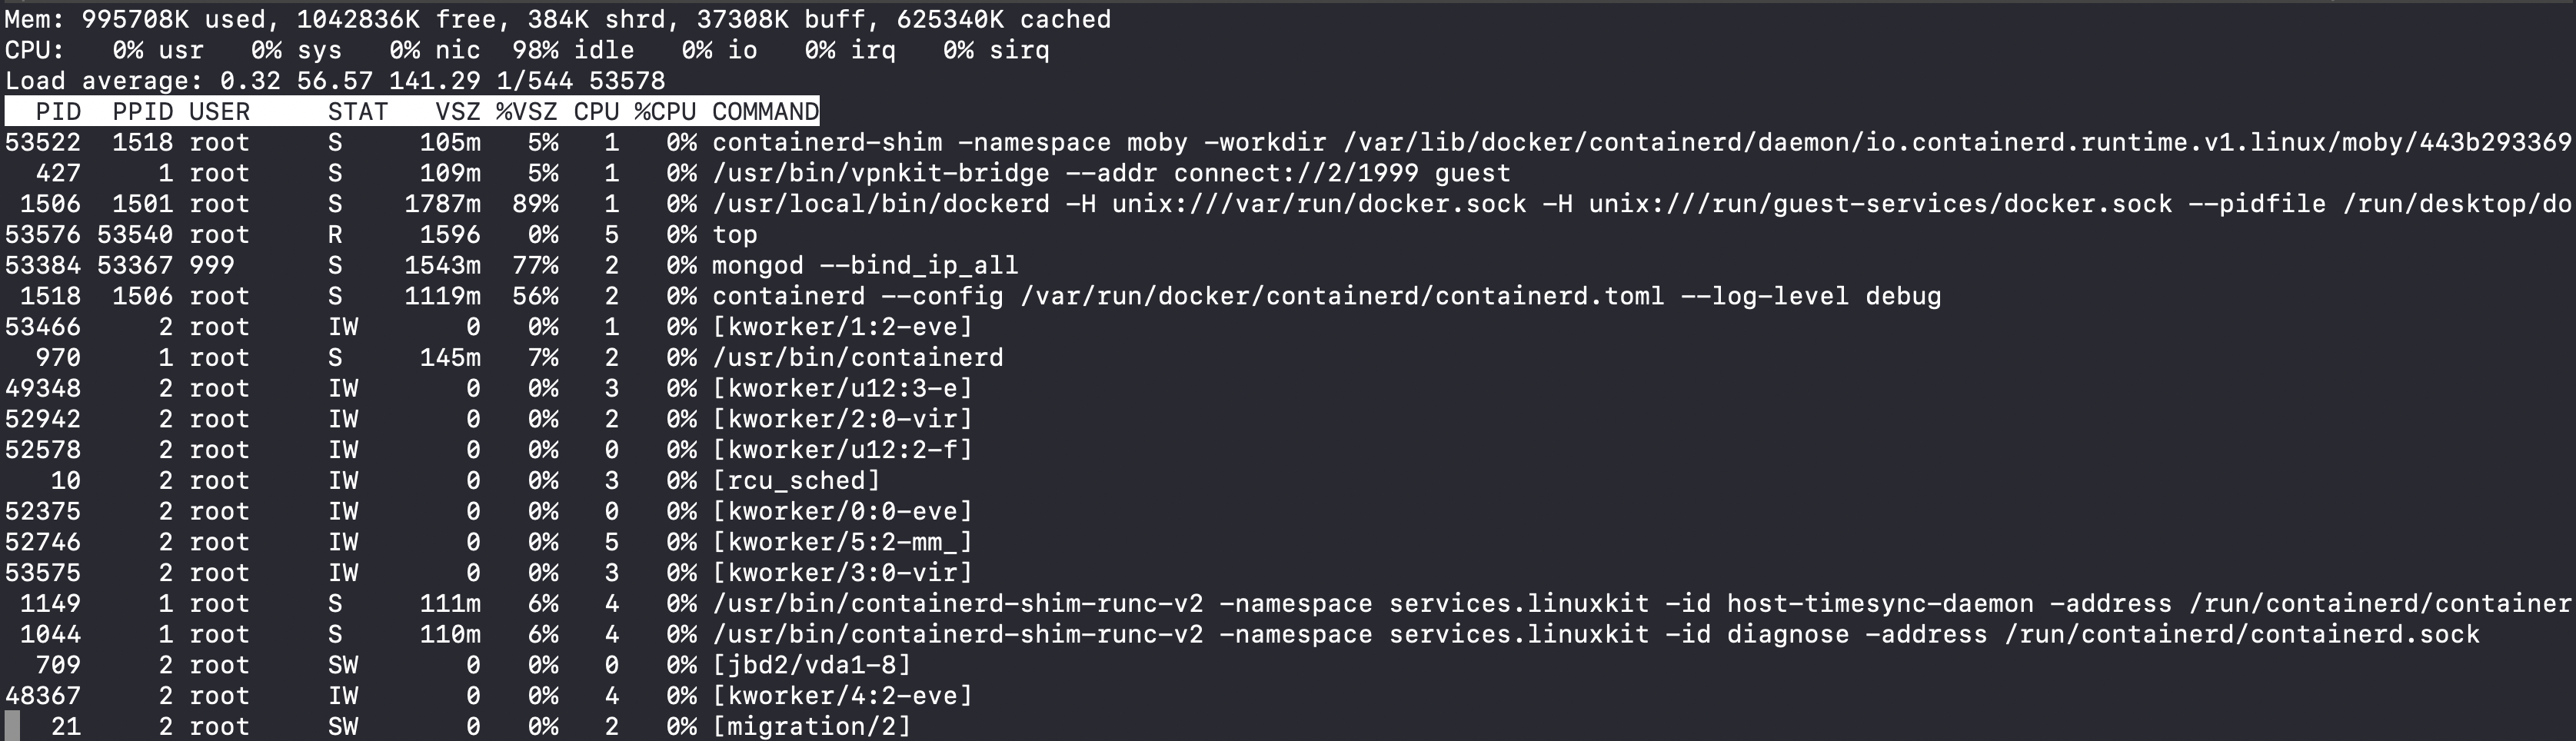
I look at top output:
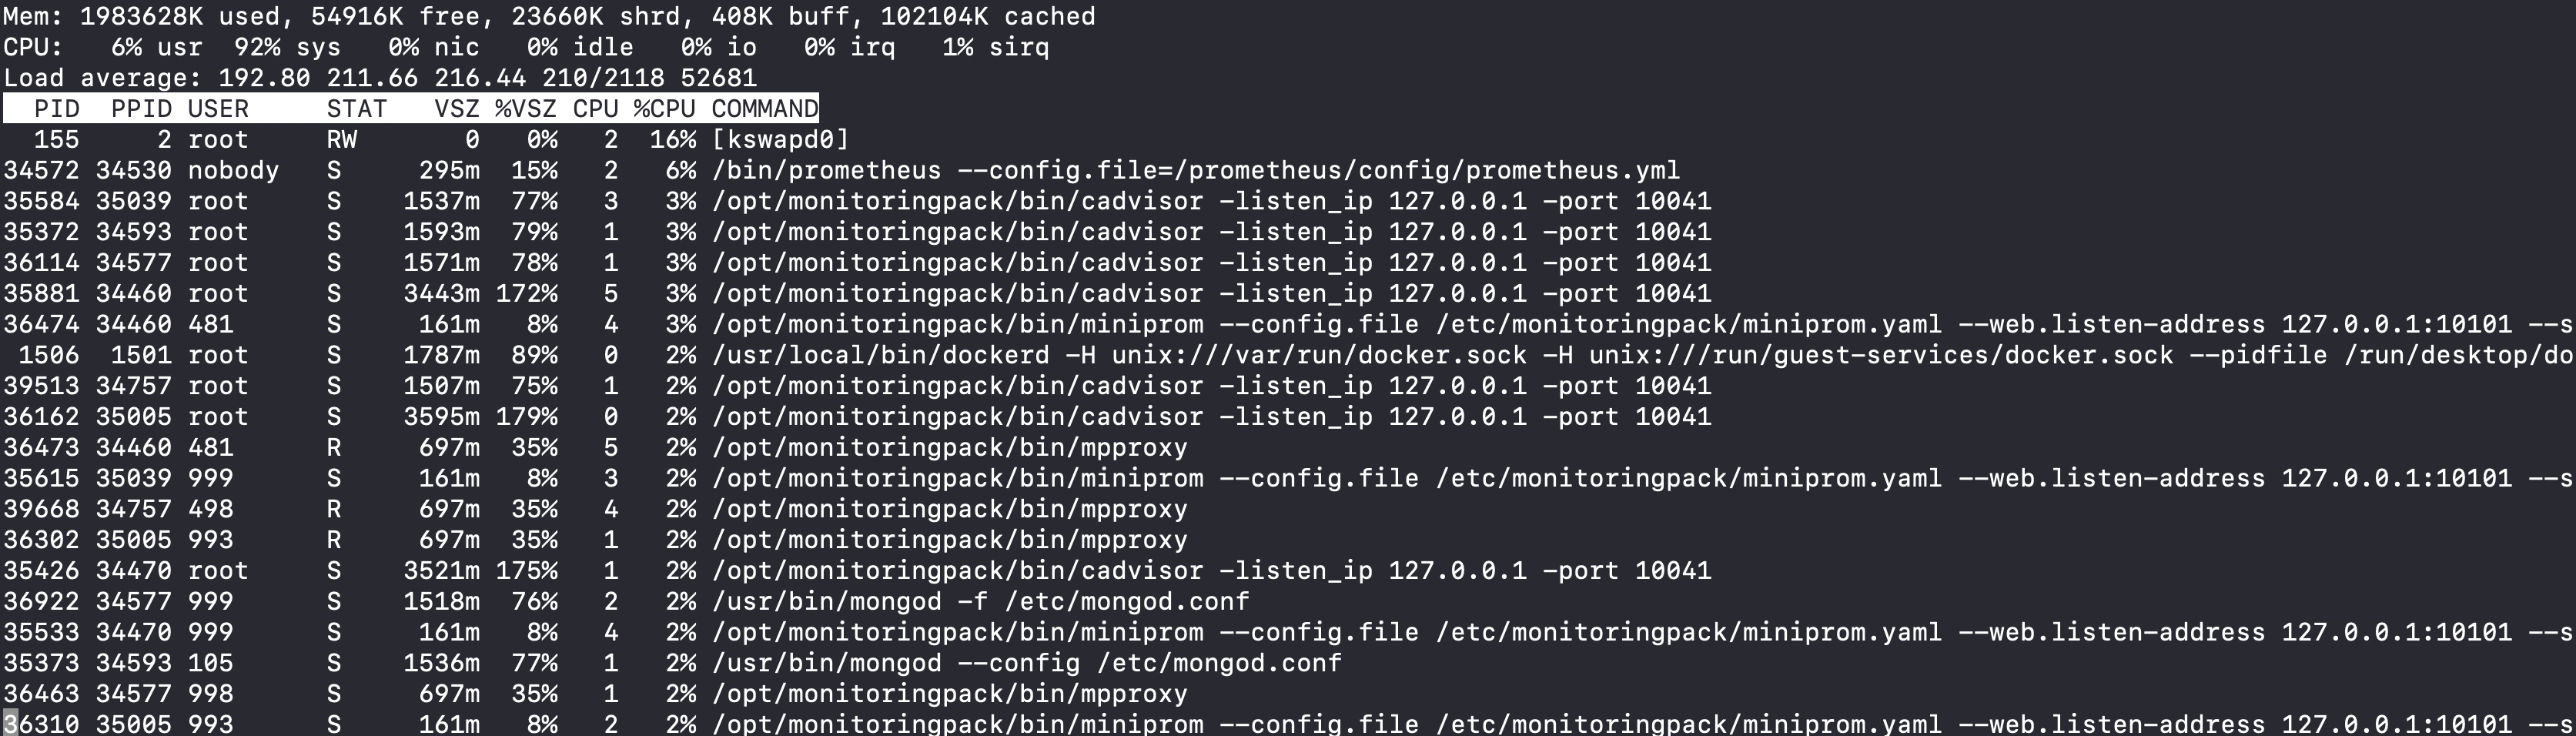
I don't see anything too alarming, although the 92% user CPU usage is pretty dang high. But I already knew that was happening. I don't see any obvious rogue processes.
This was good visibility, but I needed a baseline comparison before I could decide whether any of this was out of line. So I stopped all my "problem" containers, started up a single MongoDB container, and looked at the same system stats.
First, the IO stats:
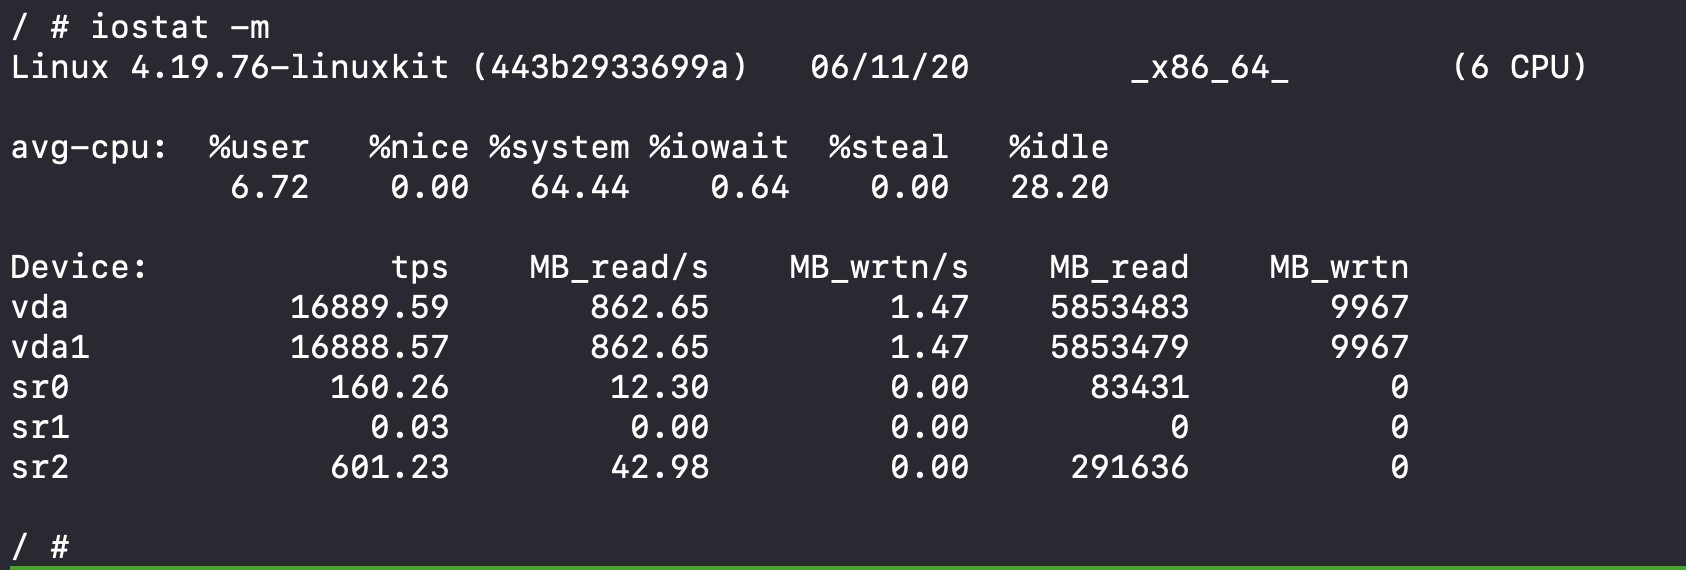
862MB of reads per second on two devices. Roughly the same as it was before. So I guess that's not as unusual as I thought 3.
The top output, however, was quite different:
usr CPU % is at 0, as are all processes on the system.
After seeing what these stats look like under working, normal conditions, I
decide to look more closely at the top output from before. The process taking up
the most CPU time is [kswapd0]. It was holding at a steady 16% CPU
utilization 4.
I wasn't sure what this process does. It took ~30 seconds to find what I needed to know:
The process kswapd0 is the process that manages virtual memory.
Maybe the VM just needs more memory?
I look again at the top output recorded in my notes, and realize something
glaring I had overlooked before. Because top by default prints memory stats in
kilobytes, and my mushy brain doesn't really process numbers with that many
digits, I hadn't payed much attention to the memory usage stats 5.
Some quick calculations showed that out of 2GB available memory in the Docker
VM, only 2% was free! Further, the VSZ column showed that several processes
were using a large amount of memory 6.
I check my Docker settings, and find that I only have 2GB of memory (RAM) allocated to Docker and only 1GB of swap:
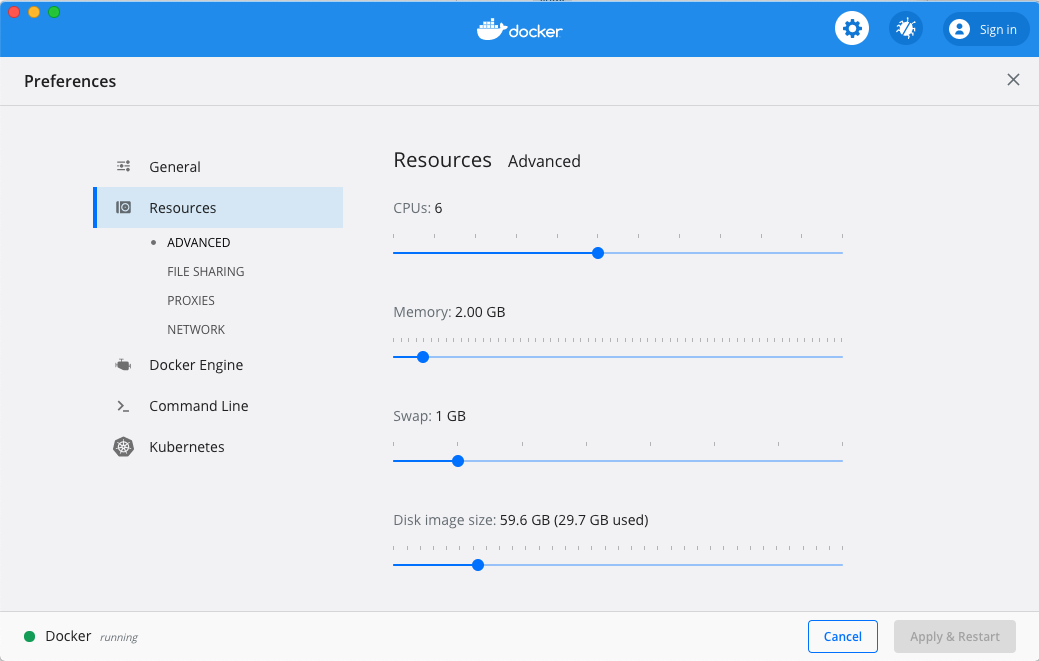
I change the swap to 4GB, start up all my containers, and everything runs
beautifully! usr CPU usage in the Docker VM is at 4%, kswpad0 CPU usage is at
0%, and com.docker.hyperkit is hovering at around 115% CPU usage. This latter
stat may seem strange, but is likely just an artifact of how CPU usage is
calculated in the Docker VM and is probably related to the fact
my machine has multiple CPU cores. In any event, my Compose environment is
stable and working as expected!
So what does this mean?
To my best reckoning, the VM was spending tons of CPU cycles shuffling bits in and out of swap because there wasn't enough resident memory allocated to the VM to run all those heavy processes. On top of that, there wasn't much swap space to work with, so the system was essentially memory starved.
Lessons Learned
After every serious debugging session, I like to reflect on the experience and identify helpful and harmful behaviors. If I do this enough, hopefully I'll get better at debugging. Here are a few thoughts:
- Any process that has constant and fairly high CPU usage is suspicious. There
could be situations where you would expect to see this, but in my case
there was no good reason to see this. The
kswapd0process was a red flag I missed the first time I saw it. - When looking at bug reports and their associated root causes, prioritize eliminating it as a possible cause as quickly as possible. Led by my initial search results concerning bind-mount performance, I spent a good deal of time reading about different bind-mount options and development history. Eventually, I removed bind-mounts from the equation entirely, and concluded it was not the problem, and could move on to other possibilities. I wish I had done this sooner; I wish I hadn't spent so much time dwelling on this possible cause. It was not all for naught, though. I did learn some things about Docker (for Mac) by pursuing that thread.
- Work from facts and be wary of assumptions that you can't support with some analysis. This is a more general statement of the previous lesson. I ran for longer than I should have with the idea that a bind-mount problem was the culprit (as discussed directly above). Validating (or invalidating) assumptions is necessary for forward progress. Sticking with unproven assumptions for too long is harmful.
- Ensure your debugging tools present information in a way that is easy for
you to read and interpret. Evidently, when I
do not heed this advice, I ignore important data.
I skipped over the glaringly obvious memory usage problem
presented by
topthe first time I looked at it. Why? Because the data was presented in kilobytes, I couldn't make sense of it easily, and moved on. But it was exactly the data I needed to see. - When looking at stats and metrics, having a real baseline (not a hypothetical one) to compare to is crucial. Aside from memory usage (which was an obvious red flag I missed), I wasn't sure whether the other statistics were unusual or not. Getting the baseline reading made the problem much easier to see. I imagine the more experience you have with a particular system, the less this may be necessary.
Addendum: Don't guess what metrics mean
I related a couple times how I concluded the output from iostat (IO
statistics) was "not unusual". I now question that conclusion.
As I used it in
this debugging adventure, iostat was reporting based on the entire history of
the VM since boot. So the 890MB_read/s is an average across quite a lot of
time. I did not restart Docker before getting my baseline reading of this
metric (with the single MongoDB container), and thus might have deceived myself.
In other words, the 890MB_read/s may actually be high compared to
normal Docker usage. However, since my "baseline" reading was essentially an average which included
the time the "problem" containers were running in the Docker VM, it probably was
not a proper baseline. A proper baseline would have been an average reading
from a fresh reboot of the VM, followed by running the single MongoDB container.
The fact that the supposed baseline reading was a bit lower than the first
reading (860MB_read/s vs. 890MB_read/s) supports this. I don't care to recreate
everything as before to verify; I'm reasonably confident that I am correct
now; I most likely fooled myself with the iostat comparison.
My inner dialogue at that point in the investigation was something like "Hmmm that seems like a big number. I wonder if that's normal." I wanted to quickly get a baseline to compare to. I was too hasty.
This seems appropriate as another "lesson learned":
If you are reasoning based on metrics, make sure you understand how those metrics are calculated. By not taking the time to think about how the MB_read/s was calculated, I created a useless comparison.
-
When you run Docker on your Mac, you're actually running a full Linux virtual machine. Since containers are essentially extensions of Linux kernel features, the way you run containers on macOS is by first running a Linux VM and then running your containers in the VM. So, Docker for Mac can be seen as sort of a glue layer between macOS and the pure Linux Docker implementation. Now you know. ↩
-
One of the containers was running Prometheus, a metrics-based monitoring tool that stores time series data on disk. The directory Prometheus was writing all its data to was bind-mounted to the macOS (host) filesystem. ↩
-
That in itself should have been enough to set my hairs up. I rarely see any process consume such a consistent amount of time on the CPU. ↩
-
You can of course shift to more readable units by supplying
-Mon the command line, or typingEwhile intop. If that doesn't work, consult the man page for your particular version oftop. ↩ -
The
VSZcolumn shows all memory accessible by the process, including shared libraries and memory in swap space. See https://stackoverflow.com/a/21049737 ↩ -
See footnote 2. ↩